
Trusted data, hands-off
Pipelines monitored 24/7 by our team, not your analysts
Bring your data, tools and vendors together. Define how your business is measured. Build everything from the same model and evolve easily as your marketing changes.
Pipeline Manager
Pipeline Manager automatically collects data from your marketing platforms and stores it in a data warehouse we provide and manage for you. Our team monitors and maintains the pipelines 24/7.
You get reliable, analysis-ready data without having to build or manage the infrastructure yourself.
Over 100 finely-tuned integrations with the ad platforms, ad servers, orgaic social analytics tools and data sources your teams already use. Authenticate once and Pipeline Manager handles the rest.
Pipelines monitored 24/7 by our team, not your analysts
Deep API integrations, not summarised exports
Years of history, ready whenever you need it
Data Hosts
Marketing doesn’t exist in isolation. Data Hosts connects to the business data you already have, so you can bring marketing data together with the outcomes that matter to your business.
No migration required, we connect to the data you already hold
MySQL, BigQuery, Snowflake, Azure SQL, Databricks and more
Secure, credentialed connections that never write back to your systems
Semantic Layer
Your analysts define the metrics, dimensions, relationships and business logic that describe your business — and can evolve them as marketing changes.
Define your metrics once and re-use them in other metrics. A governed set of definitions behind every dashboard, API call, and AI query.
The people who know your business best, in control
Every definition, every change, transparent and fully auditable
Add sources and metrics without re-architecting
Reporting and Visualisation
Create dashboards and reporting from the same governed model, so everyone works from consistent definitions. Build what your team needs in moments — and when the model changes, every report updates instantly.
Build dashboards in minutes and share them with your team. Set access levels, use interactive filters, apply drill-downs and add commentary.
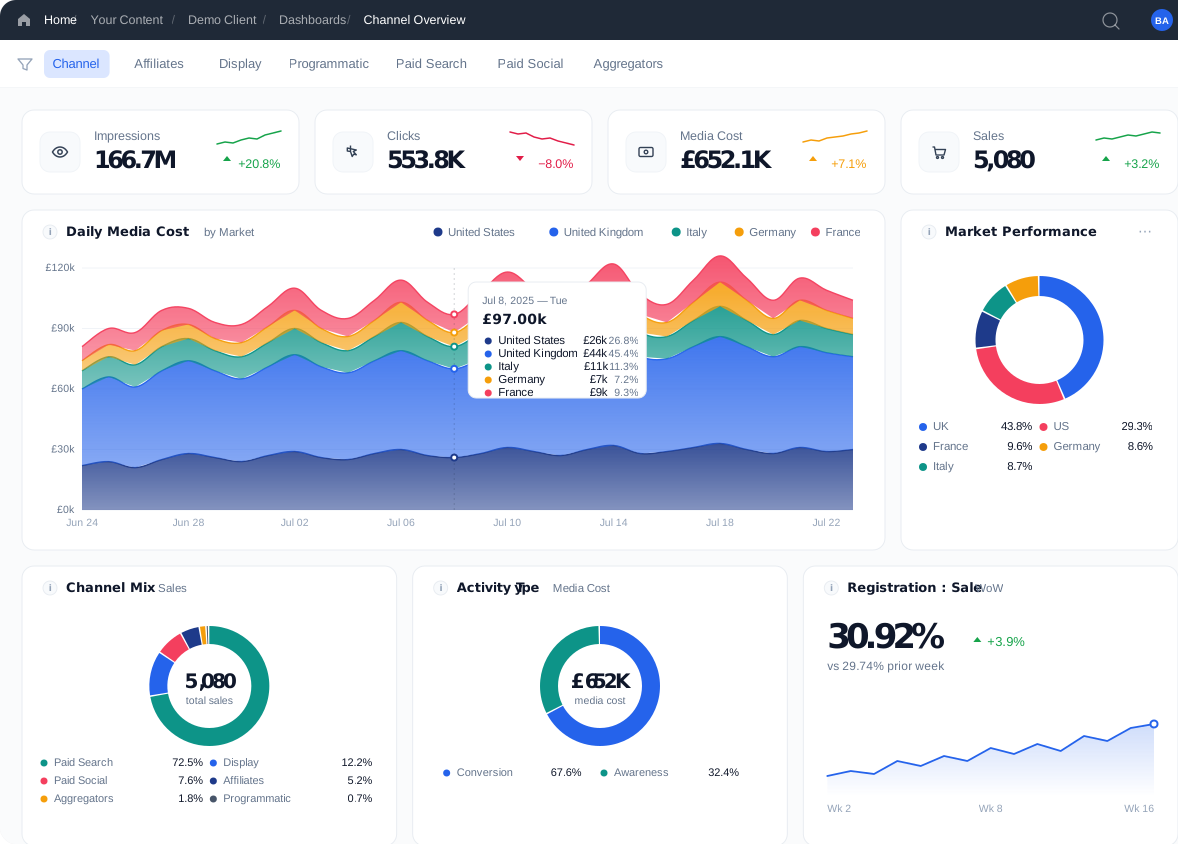
Fresh data or definition changes, everything syncs in seconds
Dashboard access defined by team and role
Automated alerts catch any KPIs that need a closer look
Reporting API
Your analytics model isn't locked inside Bright. Our Reporting API puts the same governed data and definitions to work in any tool your teams already rely on — consistent logic, wherever you need to see your data.
{
  "metrics": ["core_spend", "core_clicks", "core_sales"],
  "dimensions": ["core_channel"],
  "filters": [
    {
      "dimension": "core_channel",
      "type": "in",
      "values": ["Paid Search", "Paid Social", "Display"]
    }
  ],
  "start": "2026-05-01",
  "end": "2026-05-14"
}{
"data": [
{
"core_channel": "Paid Search",
"core_spend": 42850.25,
"core_clicks": 18420,
"core_sales": 1206
},
{
"core_channel": "Paid Social",
"core_spend": 31200.18,
"core_clicks": 24990,
"core_sales": 892
},
{
"core_channel": "Display",
"core_spend": 12400.74,
"core_clicks": 9310,
"core_sales": 214
}
]
}API reads directly from your central data model
A standard approach keeps integration simple
API calls replace one-off CSV pulls and merging
MCP Server
Ask questions in natural language and get answers grounded in the same metrics, definitions and relationships used across your analytics. Our MCP server connects Claude, ChatGPT, Gemini or Copilot directly to your semantic layer, so every answer reflects your governed model, not a generic guess.
 Bright Analytics MCP
Here's the breakdown for April 2026:
| Market | Media Cost | Registrations | CPR |
|---|---|---|---|
| UK | £74,050 | 1,001 | £73.98 |
| DE | €41,200 | 587 | €70.19 |
| US | $98,300 | 1,843 | $53.33 |
UK cost per registration is up 12% vs March. Germany is stable. US improved by 8%.
Bright Analytics MCPPaid Social CPR in UK rose 31% in April. Meta CPMs increased 18% while conversion rate dropped 9%. Google Ads held steady.
No hallucinations, all analysis based on your data model
Claude, ChatGPT, Gemini or Copilot, your choice
MCP connects your LLM to your central semantic model
Taxonomy Manager
Taxonomy Manager ensures the breakdowns you need are built into how your marketing activity is named from the start. This creates a reliable foundation for analysing your marketing data in the ways that matter to your business.
Naming correct when data lands, not cleaned up after
Analysts stop losing hours to QA and patching
Confidently bring more detail into your naming conventions
Your analysts stay in control of the model while every team, tool and capability works from the same foundation.