

Impressions tell you your ads are delivering. Reach tells you how many people saw them. But neither tells you whether you’re still reaching new people – or just burning budget on the same audience.
This post introduces a way of measuring the incremental reach of your paid advertising – the truly new users being reached every day. We call this CPIR (Cost per Incremental Reach) and this post explains why this KPI should be in all your reports, how we automate it at Bright Analytics.
Why Impressions Aren’t Enough
Every ad-stuffed webpage is a reminder of how meaningless ‘Impressions’ can be as a KPI. It’s a QA metric at best – a check that everything’s still delivering.
But whether the campaign should still be running is the real question.
Imagine you’re running Awareness activity for a new brand or product – the cost of reaching new users is a fundamental KPI to monitor. Your eCPM might be low, but you could be reaching hardly anyone new.
“What was the reach of our campaign yesterday?” (log into platform … run report for yesterday … ) “12,452” “Great. How many of those were people who’d not seen the campaign before?” “err”
How do you figure that out? Using platform reporting you’d have to run a campaign-to-date report up to the end of the day before yesterday, take that number, then run the report up to the end of yesterday, and take the difference between these two numbers. That’s a manual hassle, totally unscalable and inefficient.
But it’s essential if you want to answer the crucial question of whether your ad spend is actually achieving its goal.
We think we’ve cracked it – and maybe invented a new KPI along the way. “Cost per Incremental Reach” (CPIR) isn’t the snappiest name, but it tells an important story about the health and efficiency of your campaign.
This isn’t a KPI you can pull from the platforms. At Bright Analytics, we calculate this awkward KPI automatically – and put it in front of planners and campaign teams every day, with zero manual effort.
Why Reach Matters
Reach shows how many unique users your ads have reached. It’s essential for calculating Frequency (and spotting when you’re irritating people). Crucially, it shows when your campaign starts burning budget without reaching new users.
So Why Isn’t Reach Front and Centre?
Because it’s fiddly.
Reach is a unique count of people (really, devices or cookies), and the number changes based on the time period you’re analysing and the granularity of the data (campaign, ad set, ad, etc.).
Which creates some nasty traps. Pull data daily and you’ll overcount Reach (same person, different days). Pull data by ad and you’ll overcount Reach (same person, different creatives).
The conclusion: you can’t accurately calculate Reach from your usual delivery data. You need a different approach.
Why Platform Reporting Doesn’t Help
Say you log into an ad platform, run a report for last week, and look at the Reach figure. You’re seeing how many people you reached that week. Great! Except… not really.
That number doesn’t tell you how many of those people were already reached in earlier weeks. That’s a big blind spot. And platform UIs don’t help fill it.
We think there should be a KPI for monitoring the incremental Reach a campaign achieves each day — and we’ve worked out how to automate it.
What Cost per Incremental Reach Gives You
CPIR is a metric you can look at daily, and see how many genuinely new people your campaign has reached since it launched.
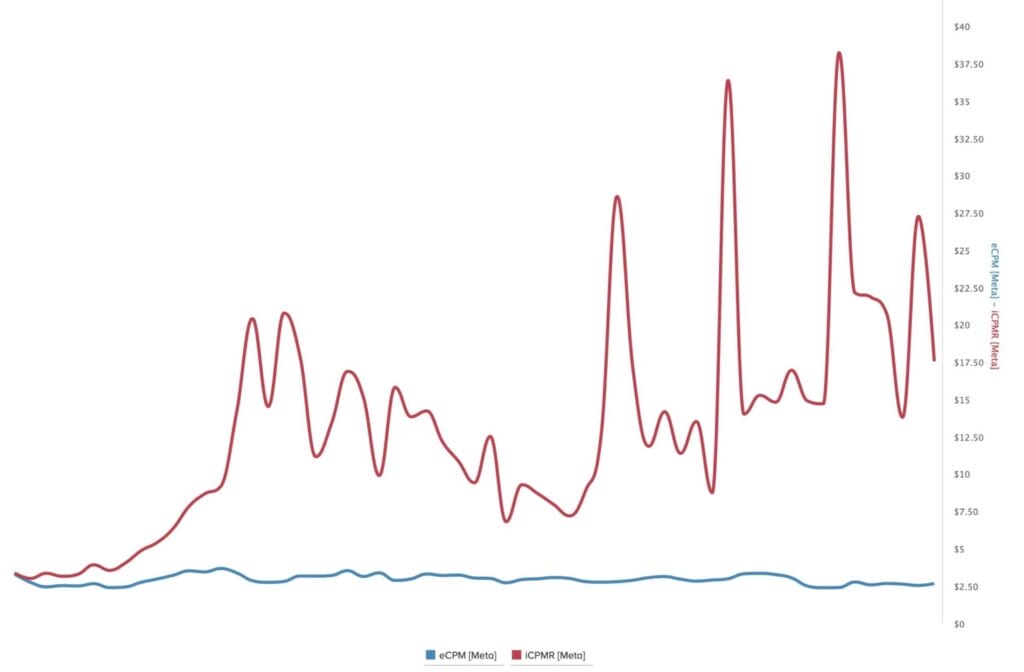
You can chart that against your eCPM and spot when things start to slow down – for example, when the cost of reaching new users begins to spike.
The chart below shows a steady eCPM across the campaign, but a rising CPIR – your budget’s still being spent, but you’re no longer expanding your audience.
How We Calculate CPIR Automatically
Where platform APIs allow us to pull campaign start and end dates and allows reporting on specific campoaign delivery we will:
- Pull a list of campaign IDs and their start date and end date
- For each campaign, we fetch the Total Reach from the campaign start to today.
- We store this number as ‘Reach’
- We then calculate the daily incremental Reach.
- We do this with a fancy SQL transformation which compares the Reach on a given day for each campaign to the reach figure for that campaign on the previous data
- We store the difference between these 2 figures as the daily incremental reach for that campaign each day’s total to the day before
- We store that value as a custom field in our Reach dataset.
This gives our customers a daily operational metric – CPIR – which they can trend over time, or aggregate over any period.
It works for both historic and in-flight campaigns, so you can pinpoint exactly when Reach began to tail off – and why.
And because the process is fully automated (even across hundreds of campaigns), it becomes part of your core reporting – not an afterthought.
Of course, we’re not deduping Reach across platforms (still a dream) – but we’re as rigorous as the APIs allow. If a campaign is still spending but the cost of reaching anyone new becomes prohibitive, that’s a red flag worth spotting.
Stop Guessing, Start Measuring
If you’ve spent too many hours exporting data and trying to work out Reach in Excel, you’re not alone. CPIR gives you a daily, automated signal for when a campaign is still spending but no longer growing your audience.
If that’s a blind spot in your reporting, get in touch.
More insights from Bright Analytics


Book a Bright Analytics Demo
No hard sell. We want to hear about your current reporting & analytics, any pain points and what is on your wish list. We’ll show what’s possible with Bright Analytics and answer any questions you have.
Book a Demo