Create a single source of truth
with advanced data integrations and analytics
Integrate, manage, analyse, and visualise data from various sources with powerful analytics and expert support.
Connect and understand
your data in a single location
Our platform flawlessly integrates with a variety of data sources to give you a unified view of
your business. With advanced analytics features designed for ease of use, understanding
your data couldn’t be simpler.
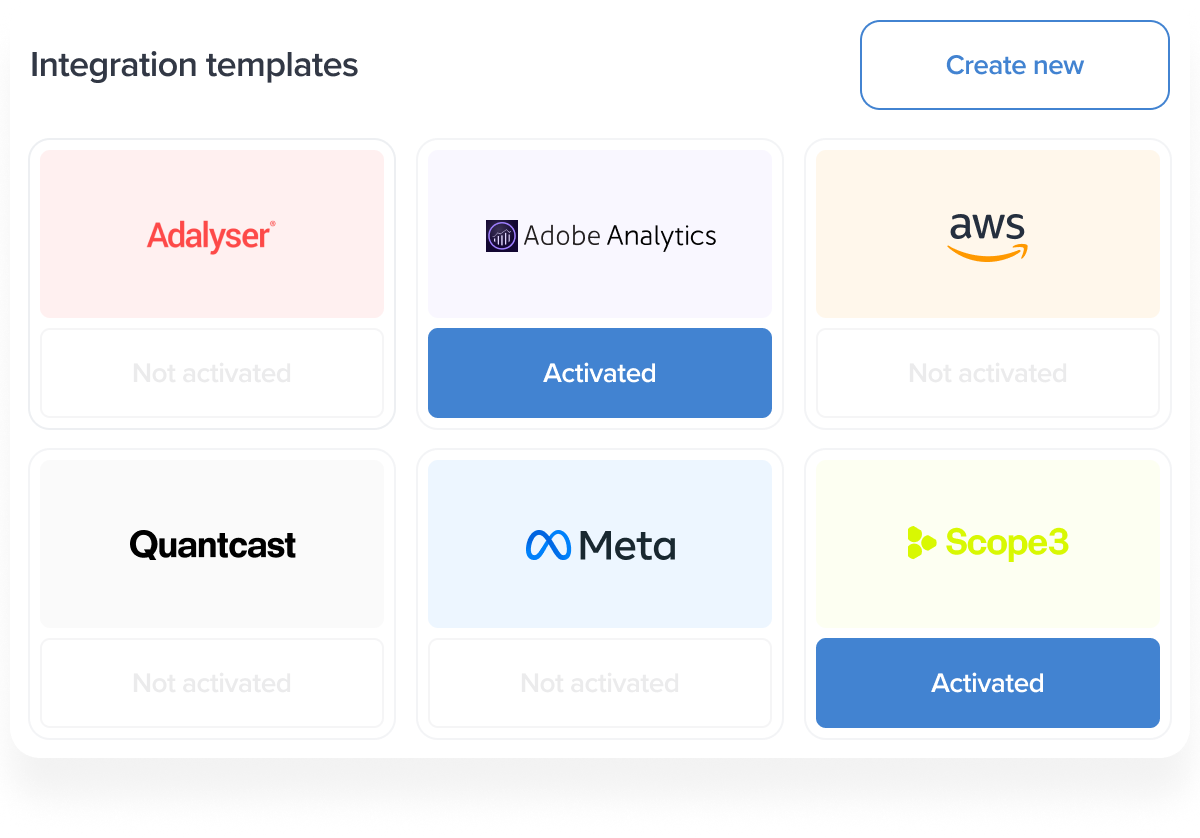
Data acquisition
Data acquisition
Easily gather and manage your marketing data with our fully managed service. Our platform simplifies the process of bringing together information from various sources so you can focus on what matters.
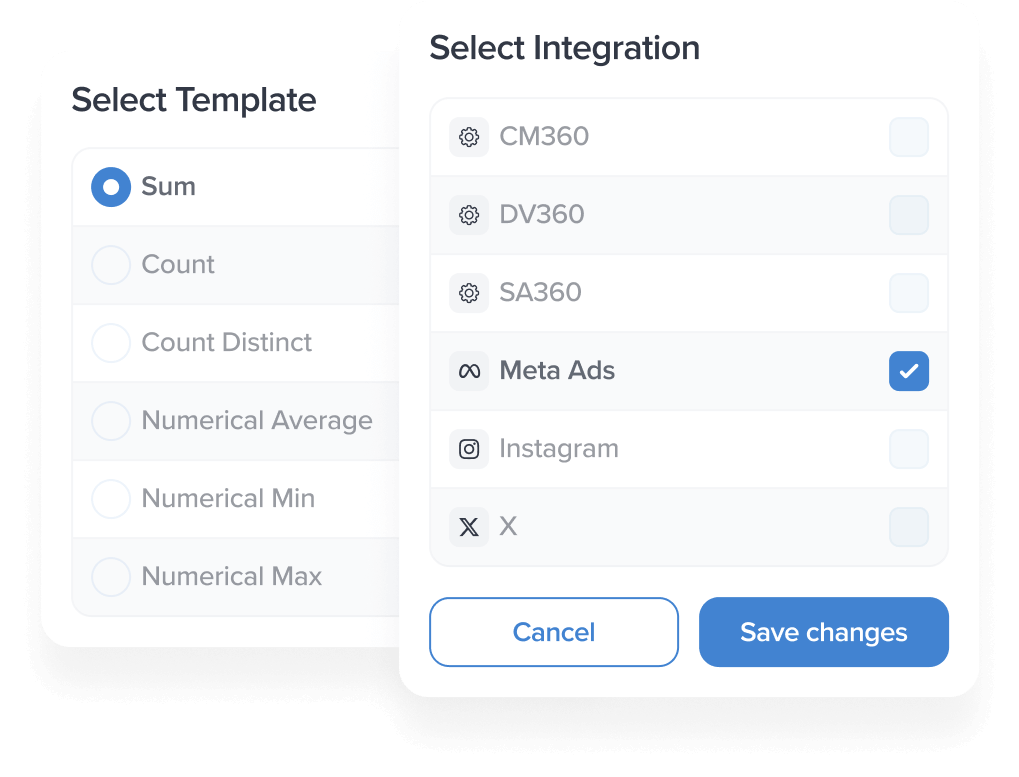
Semantic layer
Semantic layer
Simplify complex data with our smart Semantic Layer. We make it easy to analyse your data, empowering you to make better decisions.
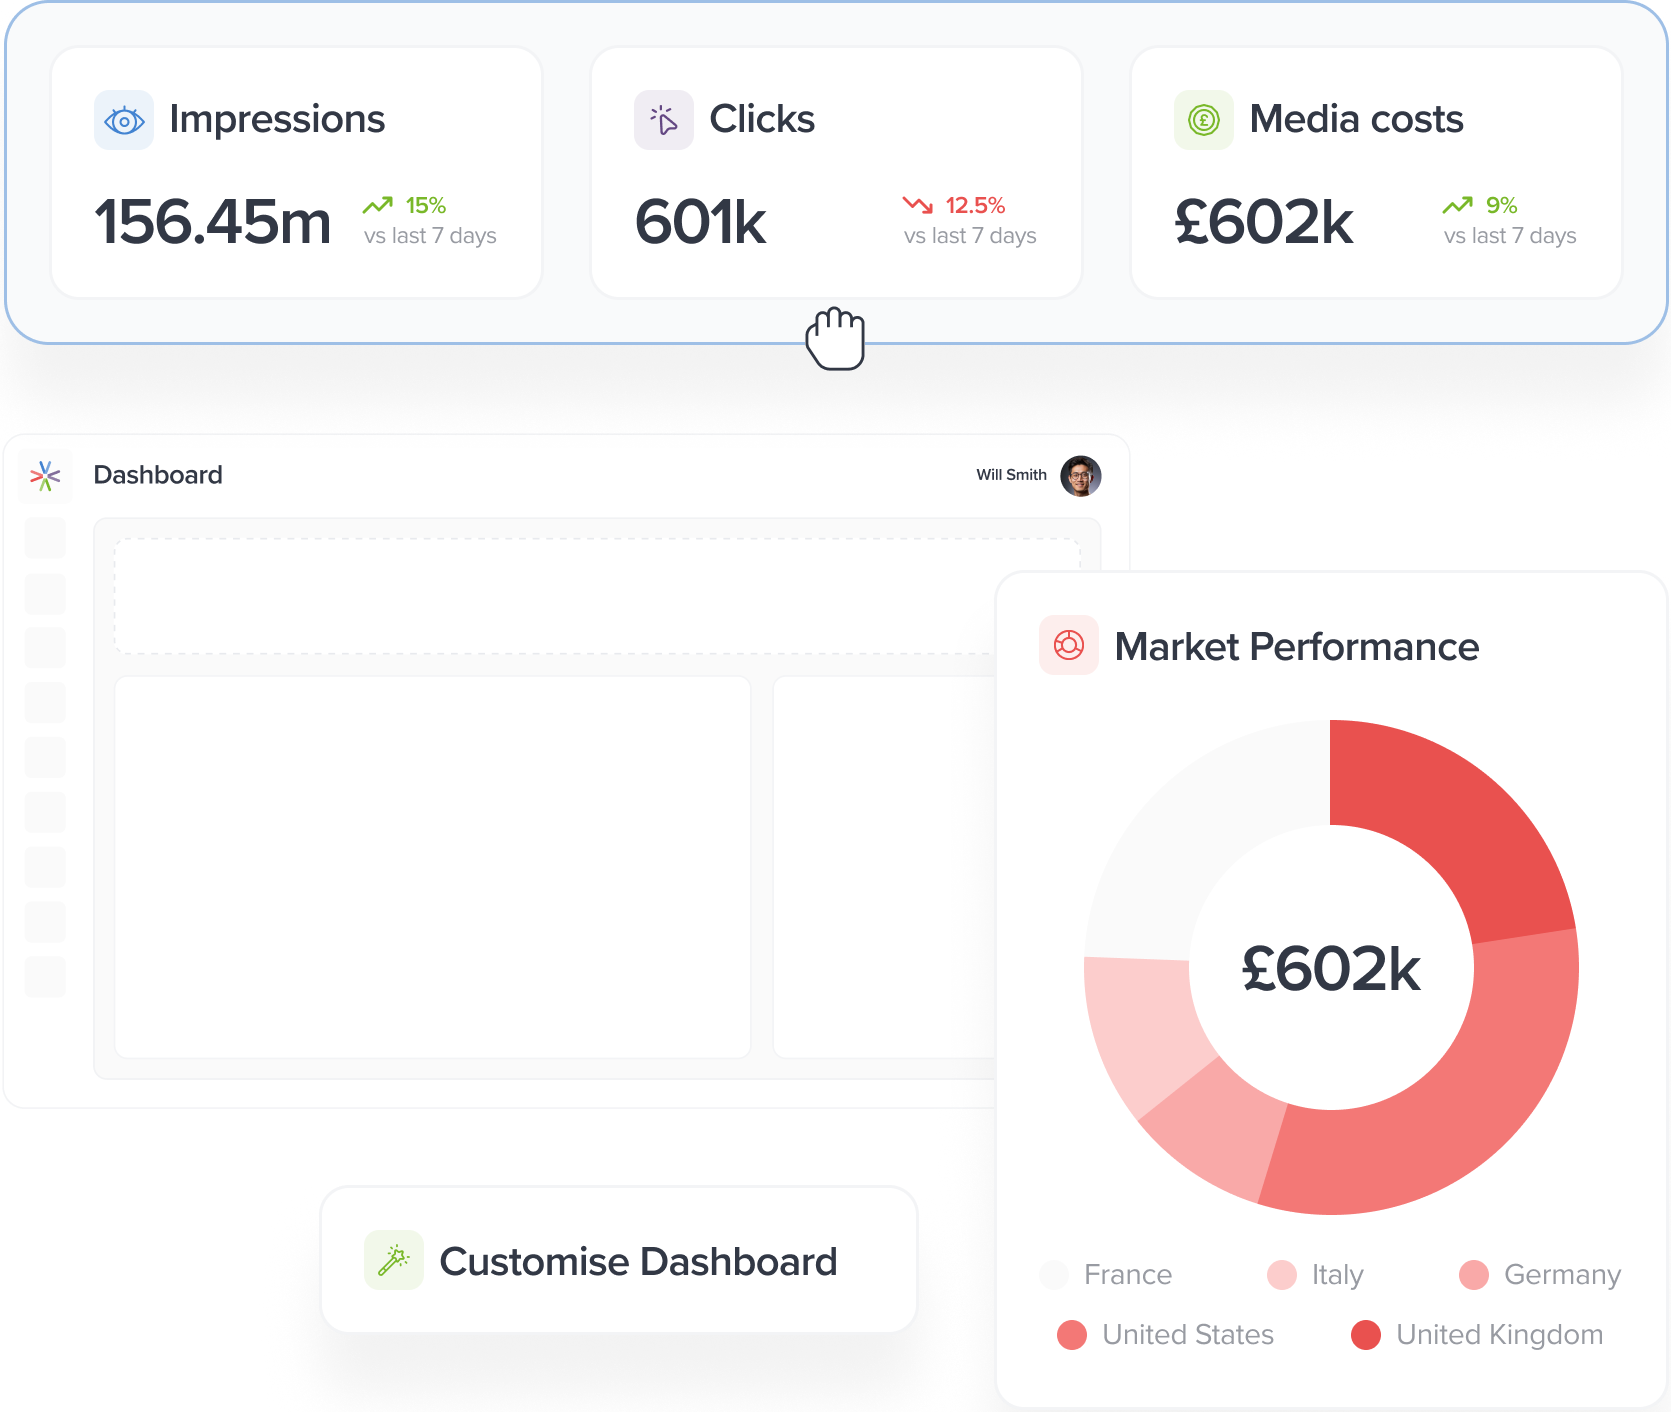
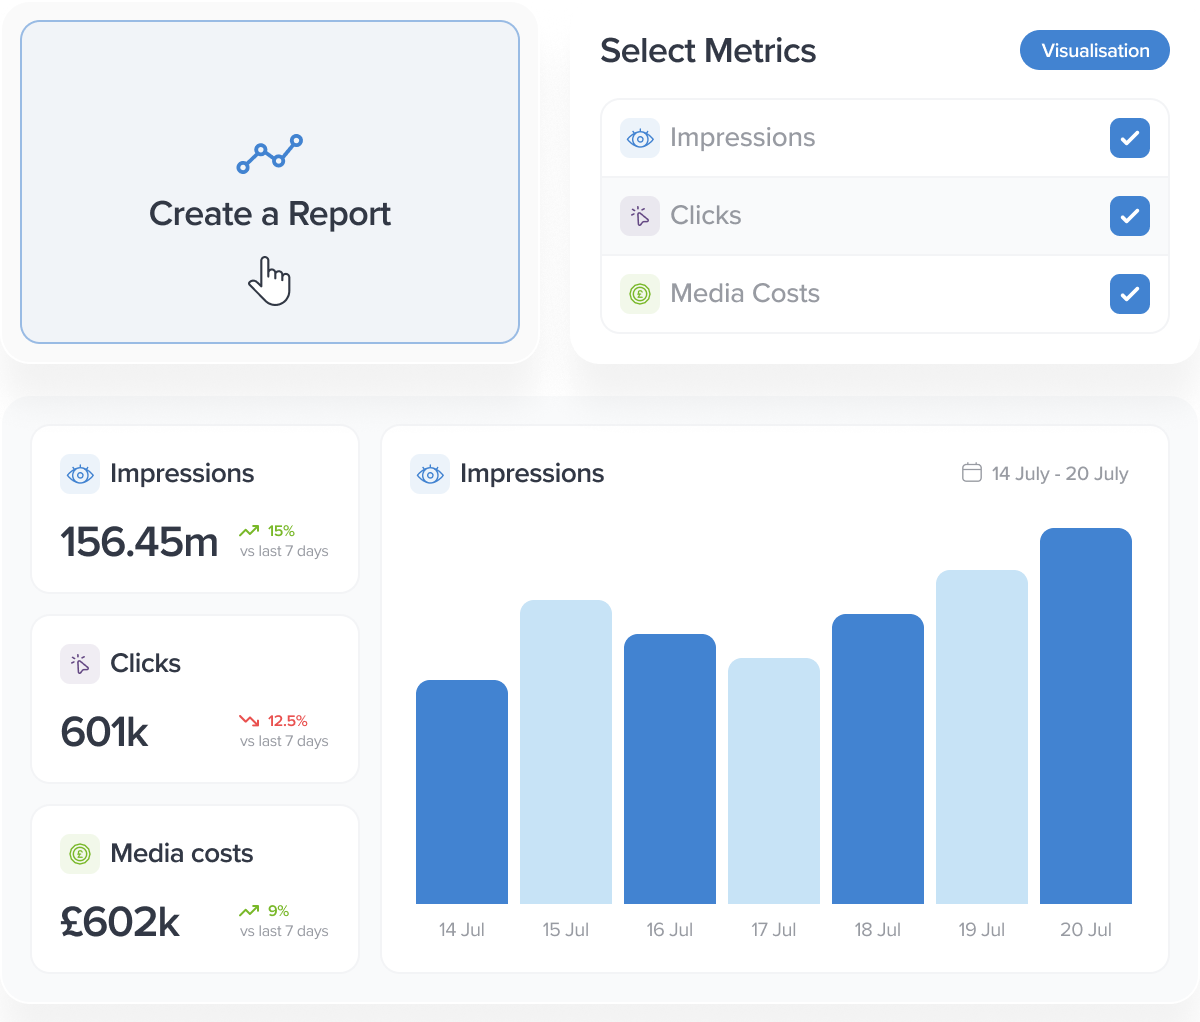
Data visualisation
Data visualisation
Our visualisation tools transform raw information into engaging stories, revealing hidden insights and untapped potential.
See what Bright Analytics
can do for you
Unlock the full potential of your data with our powerful platform. Experience seamless integration, efficient data transformation, and insightful analytics designed to drive your business forward.
-

One-click integrations
Connect APIs, databases, spreadsheets and cloud storage.
-
No-code semantic layer
Define the KPIs and taxonomy for your business goals.
-
Self-service analytics
Enable users to create their reports without relying on IT for analytics.
-
Automated data QA
Automated notification of unexpected changes to your KPIs.
Access the power of
your data in less than a week
Don’t let complex data hold you back. Our platform simplifies the data
integration and analysis process, so you can focus on driving your
business forward. We’ll have your customised solution up and running in
less than a week.