Starter
£500/ month
Model your data and put it to work in live dashboards.
Free trial Semantic layer
 Reporting
- 1 admin user
- 5 reporting users
- 1 data host
- Custom data model
- Unlimited dashboards
- Live-chat support
Put your analysts in control of your data modelling.
Our no-code interface lets your analysts build a shared, governed data model that powers our BI layer, Reporting API and MCP server. Your data stays in your warehouse. Bright Analytics sits on top. All teams and tools work from the same shared definitions.
“Bright Analytics have been instrumental in helping us to create bespoke, world class reporting and analytics frameworks for some of our largest and most complex clients.”
 Steve PeacockHead of Digital Trading & Operations, OMD UK
Bring your existing databases and warehouses into Bright Analytics. Build a shared model around the data your business already holds, with connections managed in one place.
Business knowledge belongs in your data model. Let your analysts define reusable metrics, map dimensions across sources and refine the logic as your reporting needs evolve.
Define your metrics once and re-use them in other metrics. A governed set of definitions behind every dashboard, API call, and AI query.
Give teams the freedom to build dashboards and reports around their questions, using the metrics and dimensions your analysts have defined.
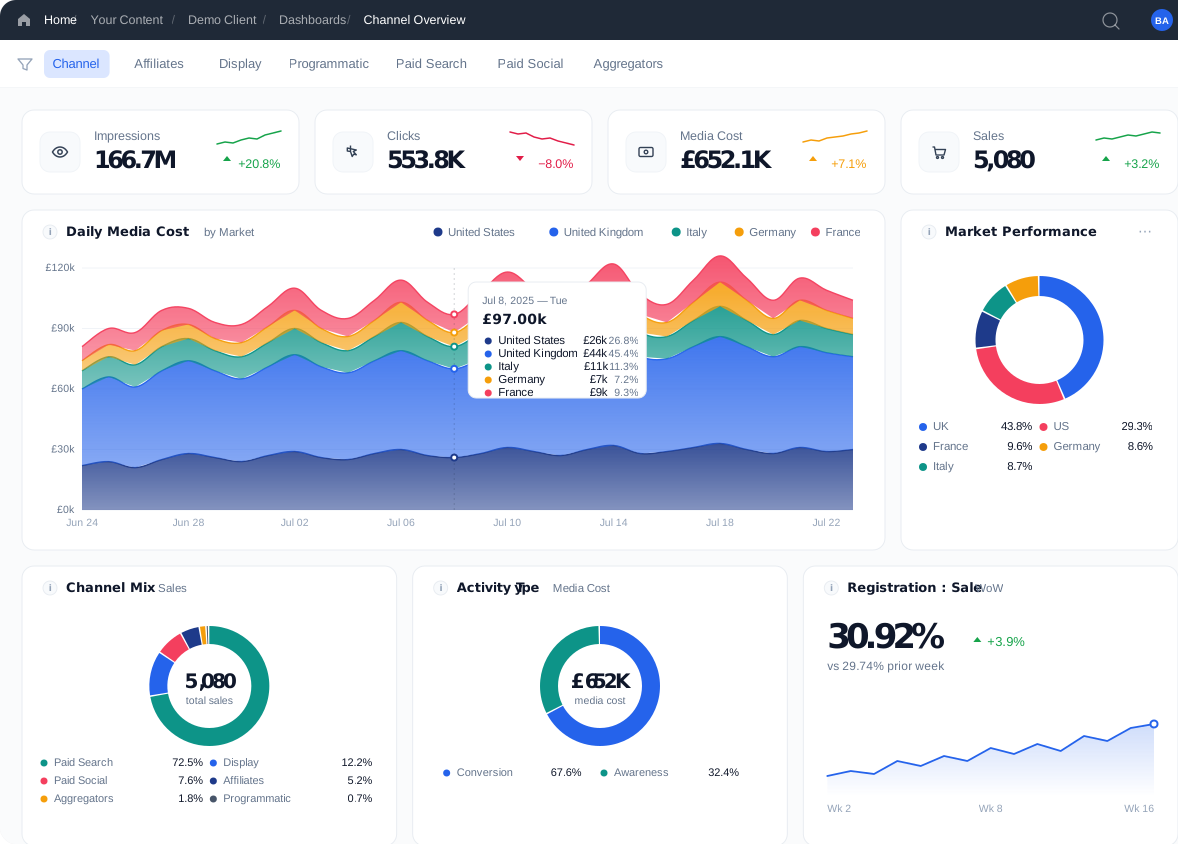
Build dashboards in minutes and share them with your team. Set access levels, use interactive filters, apply drill-downs and add commentary.
Use the Reporting API to bring governed metrics and dimensions into your applications and workflows. Keep the business logic in one model as you build new ways to use the data.
{
  "metrics": ["core_spend", "core_clicks", "core_sales"],
  "dimensions": ["core_channel"],
  "filters": [
    {
      "dimension": "core_channel",
      "type": "in",
      "values": ["Paid Search", "Paid Social", "Display"]
    }
  ],
  "start": "2026-05-01",
  "end": "2026-05-14"
}{
"data": [
{
"core_channel": "Paid Search",
"core_spend": 42850.25,
"core_clicks": 18420,
"core_sales": 1206
},
{
"core_channel": "Paid Social",
"core_spend": 31200.18,
"core_clicks": 24990,
"core_sales": 892
},
{
"core_channel": "Display",
"core_spend": 12400.74,
"core_clicks": 9310,
"core_sales": 214
}
]
}Connect AI to your shared model so its queries use the same metrics and dimensions as your dashboards and reports.
 Bright Analytics MCP
Here's the breakdown for April 2026:
| Market | Media Cost | Registrations | CPR |
|---|---|---|---|
| UK | £74,050 | 1,001 | £73.98 |
| DE | €41,200 | 587 | €70.19 |
| US | $98,300 | 1,843 | $53.33 |
UK cost per registration is up 12% vs March. Germany is stable. US improved by 8%.
Bright Analytics MCPPaid Social CPR in UK rose 31% in April. Meta CPMs increased 18% while conversion rate dropped 9%. Google Ads held steady.
Model your data and put it to work in live dashboards.
Free trialSemantic layerReportingUnify your data warehouses and clouds in one semantic layer.
Book a demoSemantic layerReporting AI
AI API
APIYes. Connect your existing databases and warehouses through Data Hosts, including BigQuery, Snowflake, Databricks, MySQL and Azure SQL.
Your analysts define and refine the metrics and dimensions, bringing their knowledge of your business into the model. Bright Analytics supports your team as the model evolves.
The updated definition is shared across dashboards, reports, API requests and AI queries. Teams can evolve their reporting while keeping the underlying business logic consistent.
The Semantic Layer is the modelling foundation of the Marketing Analytics Platform. This solution focuses on connecting your existing data infrastructure and making a shared model available to reporting, APIs and AI.
Start a free 14-day trial, or talk to us about your data infrastructure, metrics and reporting needs.